7 Ways to Track Content Engagement in Real-Time

7 Ways to Track Content Engagement in Real-Time
Want to understand how your content performs in real time? Here are 7 tools to help you track user engagement, identify trends, and make smarter decisions fast.
Quick Overview:
- Journey.io: Combines multiple content types into one trackable link and integrates with tools like HubSpot and Google Drive.
- Google Analytics 4 (GA4): Tracks events like video plays, downloads, and scroll depth with customizable metrics.
- Hotjar: Uses heatmaps and session recordings to visualize user behavior.
- Mixpanel: Offers segmentation, funnels, and account-level analytics for detailed insights.
- HubSpot: Tracks email opens, clicks, and engagement timelines with CRM integration.
- Sprout Social: Monitors social media metrics like impressions, sentiment, and response time.
- Optimizely: A/B testing platform with real-time metrics and advanced statistical analysis.
Why It Matters:
- 50% of organizations see increased retention and revenue with real-time analytics.
- Personalized offers are a priority for 74% of B2B buyers.
- Tools like these help avoid losing the 65% of buyers who switch brands due to poor engagement.
Ready to optimize your content strategy? Keep reading for detailed insights on each tool.
Data-Driven Marketing Analytics: Transform Campaigns with Real-Time Insights
1. Journey.io Analytics Dashboard
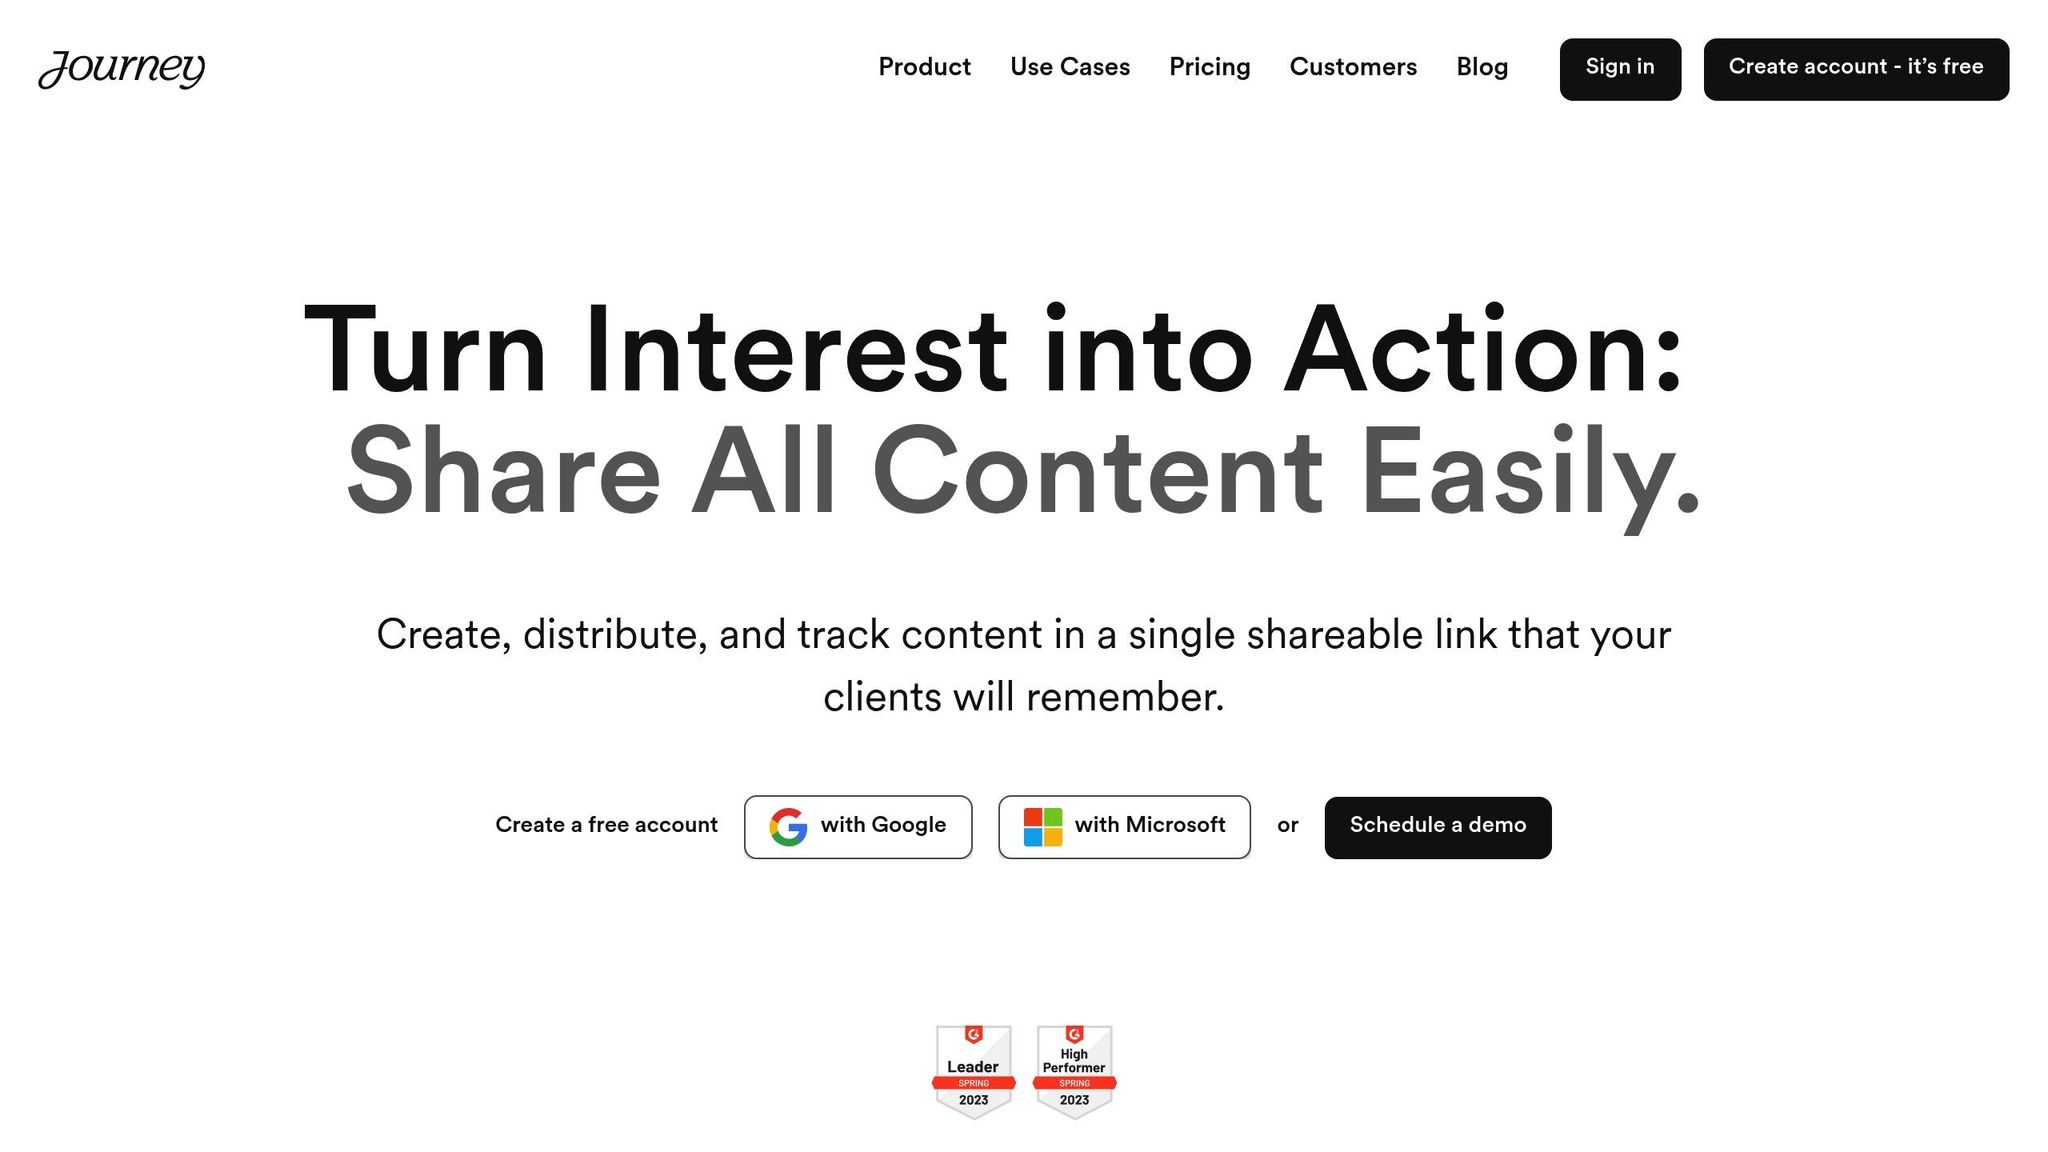
In the fast-paced world of B2B SaaS, real-time insights are key. Journey.io's dashboard delivers actionable data to help teams make informed decisions quickly. It combines live updates with tracking tools tailored specifically for B2B SaaS workflows.
One standout feature is its ability to combine multiple content types - like PDFs, videos, text, and links - into a single, shareable link. This makes it easier to track engagement across formats without juggling several tools.
Journey.io also integrates seamlessly with popular B2B tools like Google Drive and Gong, giving teams a clear picture of how prospects interact with their content.
The dashboard lets teams observe prospect behavior in real time, analyze engagement trends, and identify which materials perform best. For larger teams, the Enterprise plan ($79 per user/month) offers extras like custom domain support and HubSpot integration, making it a strong option for businesses needing detailed tracking.
Other helpful tools include a chatbot for instant responses to prospect questions and a comment system for collecting direct feedback. These features provide deeper context beyond just numbers. For added security, the platform includes options like password protection and IP whitelisting. Its mutual plans even allow teams to track prospect progress through checkpoints, helping identify and resolve bottlenecks efficiently.
2. Google Analytics Event Tracking
Google Analytics 4 (GA4) transforms user interactions into actionable insights, offering a clear view of how users engage with your content. By defining key interactions like form submissions, downloads, video plays, subscriptions, or phone clicks, you can track metrics that directly impact business goals - especially for B2B SaaS companies.
GA4's Enhanced Measurement feature automatically tracks essential engagement metrics, making it easier to understand user behavior:
| Event Type | What It Tracks | Business Impact |
|---|---|---|
| Page Views | User navigation patterns | Highlights popular content |
| Scroll Depth | Content consumption | Measures engagement depth |
| Outbound Clicks | External link interactions | Tracks resource usage |
| File Downloads | Resource engagement | Supports lead generation |
| Video Engagement | Watch time and completion | Assesses content impact |
For more flexibility, GA4 allows you to create custom events tailored to your needs. As Gemma Fontané, SEO Consultant at Orvit Digital, explains:
"Events are the metrics that allow you to measure specific user interactions on a website, such as loading a page, clicking on a link or submitting a form".
Tips for Setting Up Effective Tracking
- Define Clear KPIs: Ensure your metrics align with your business goals.
- Use Google Tag Manager: Simplify the process of creating triggers for custom events.
- Test in DebugView: Check your tracking setup to ensure accuracy.
- Register Custom Parameters: Add detailed reporting options for deeper insights.
Julius Fedorovicius, an expert in Google Analytics, emphasizes the shift in GA4's approach:
"Everything is now an event in Google Analytics 4 - even pageviews."
To keep your data organized and actionable, use consistent naming conventions for events. GA4's DebugView is an excellent tool to verify your setup and make quick adjustments when needed.
3. Hotjar User Behavior Tools
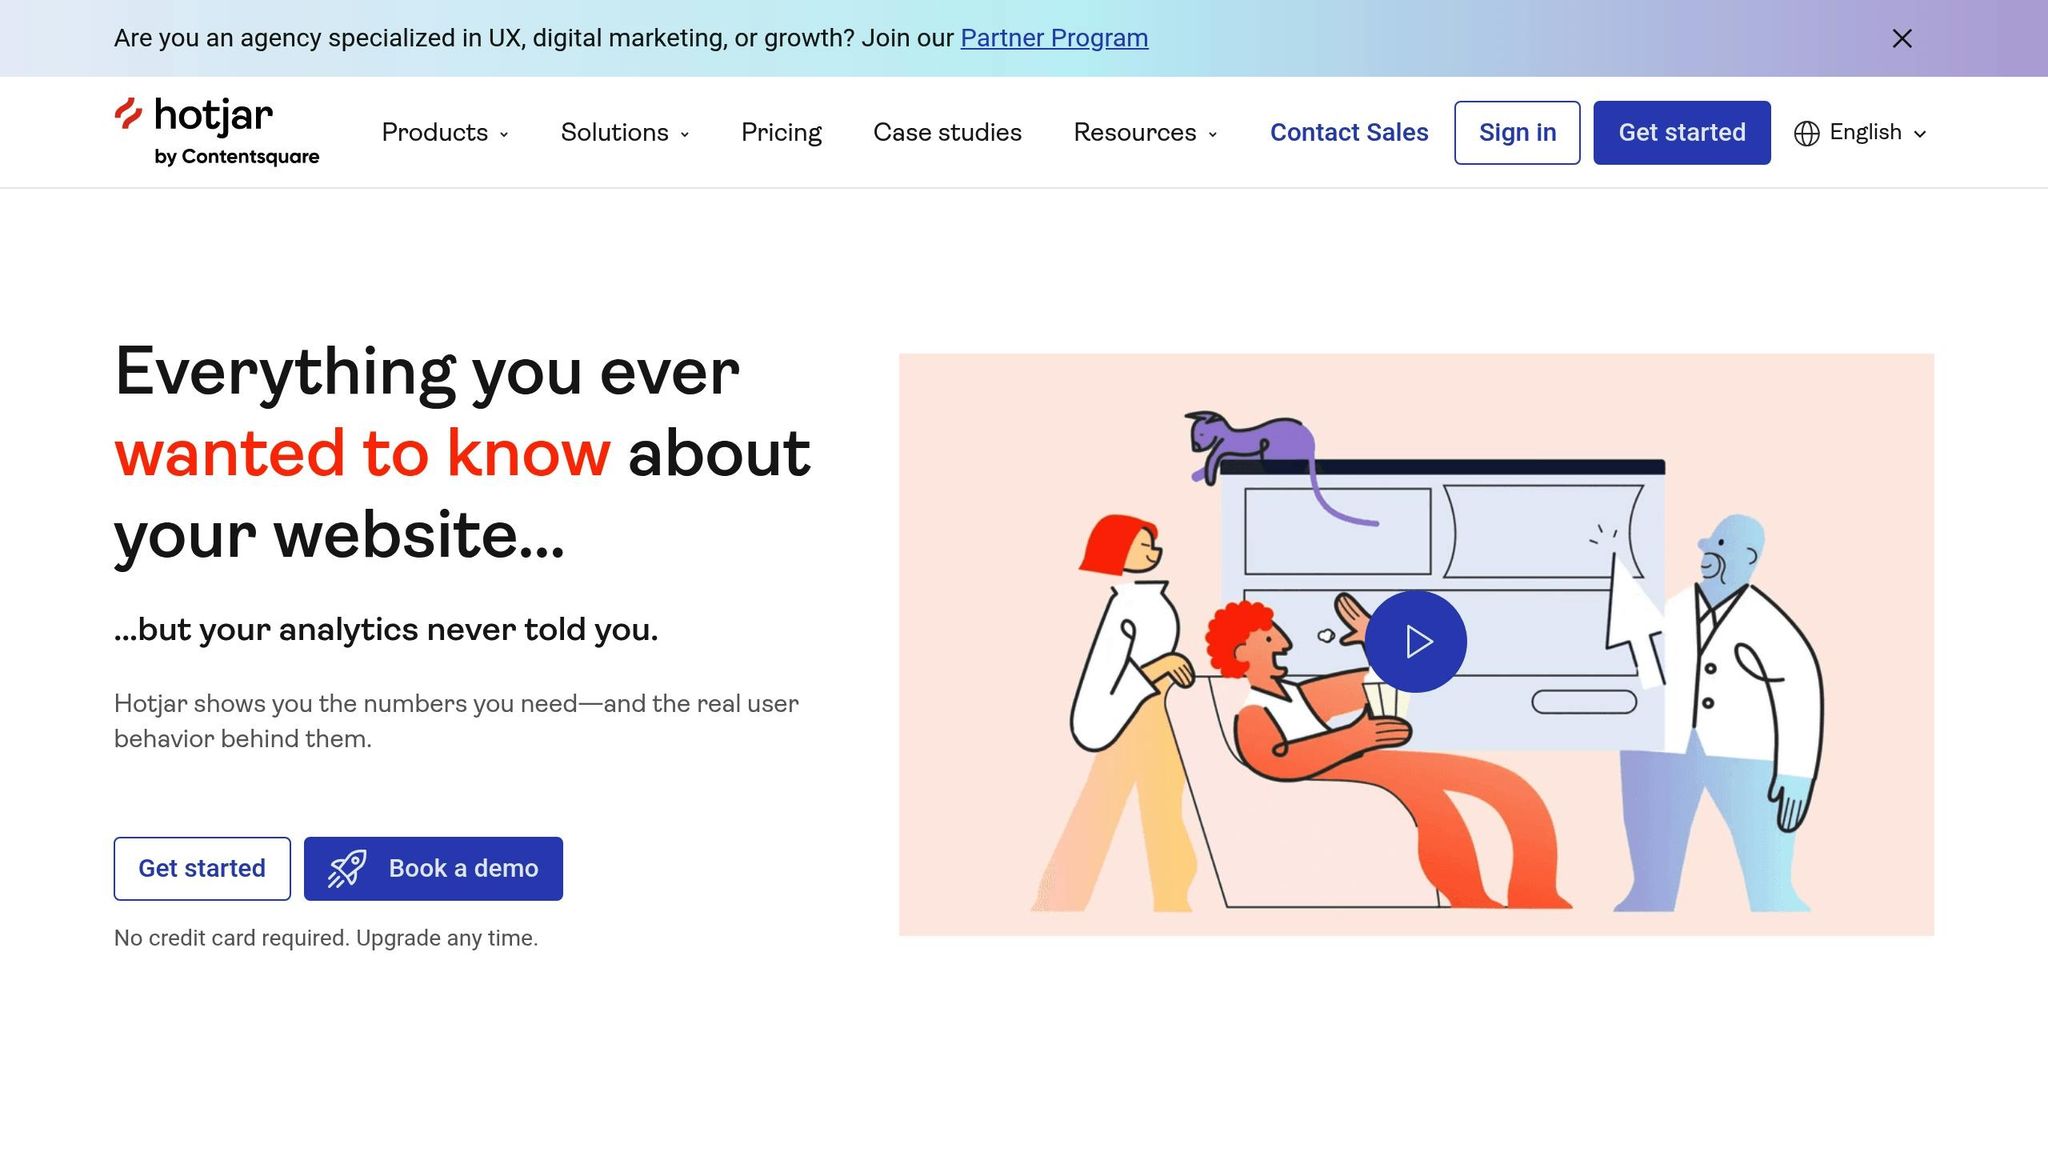
Understanding how users interact with your site is crucial for boosting engagement. Hotjar offers insights into user behavior from over 1.3 million websites in 180+ countries. Its tools turn raw data into clear, actionable visuals.
Heatmap Analytics
Hotjar's heatmaps visually showcase user behavior by tracking three key activities:
| Heatmap Type | Tracks | Key Insights |
|---|---|---|
| Click/Tap | Buttons and links | Highlights the most clicked elements |
| Move/Hover | Cursor movement | Shows attention patterns, with a 64% link to eye movement |
| Scroll | Scrolling depth | Reveals which parts of the page get the most visibility |
"If you don't know what you're looking for in your heatmaps, you're basically screwed because you're literally looking for a needle in a haystack."
When paired with session recordings, heatmaps offer a complete view of user engagement.
Session Recording Insights
Session recordings allow you to replay user sessions, offering context to heatmap data. For instance, Audiense used this tool to identify and fix a broken password validator, restoring their conversion rates in just a few hours.
"When you can show a founder multiple recordings of a frustrated client because of a UX choice, it's not you vs. the founder anymore. The founder sees their customers being frustrated and realizes there has to be a better way."
These recordings provide direct evidence of user pain points, making it easier to prioritize fixes.
Best Practices for Implementation
- Focus on specific questions about user behavior.
- Combine heatmaps with session recordings and surveys for deeper insights.
- Analyze data by segmenting users into groups.
- Monitor interactions before and after implementing updates.
Hotjar also offers an engagement scoring system that evaluates visitors based on time spent on a page, pages per session, and click data. With integrations for tools like Google Analytics, Unbounce, and Zapier, you can streamline workflows and optimize content engagement. For example, Re:member redesigned their application process using session recording insights, leading to a 17% increase in form conversions.
Hotjar equips teams with the tools needed to make quick, informed decisions that improve user experience.
sbb-itb-e400484
4. Mixpanel User Data Tracking
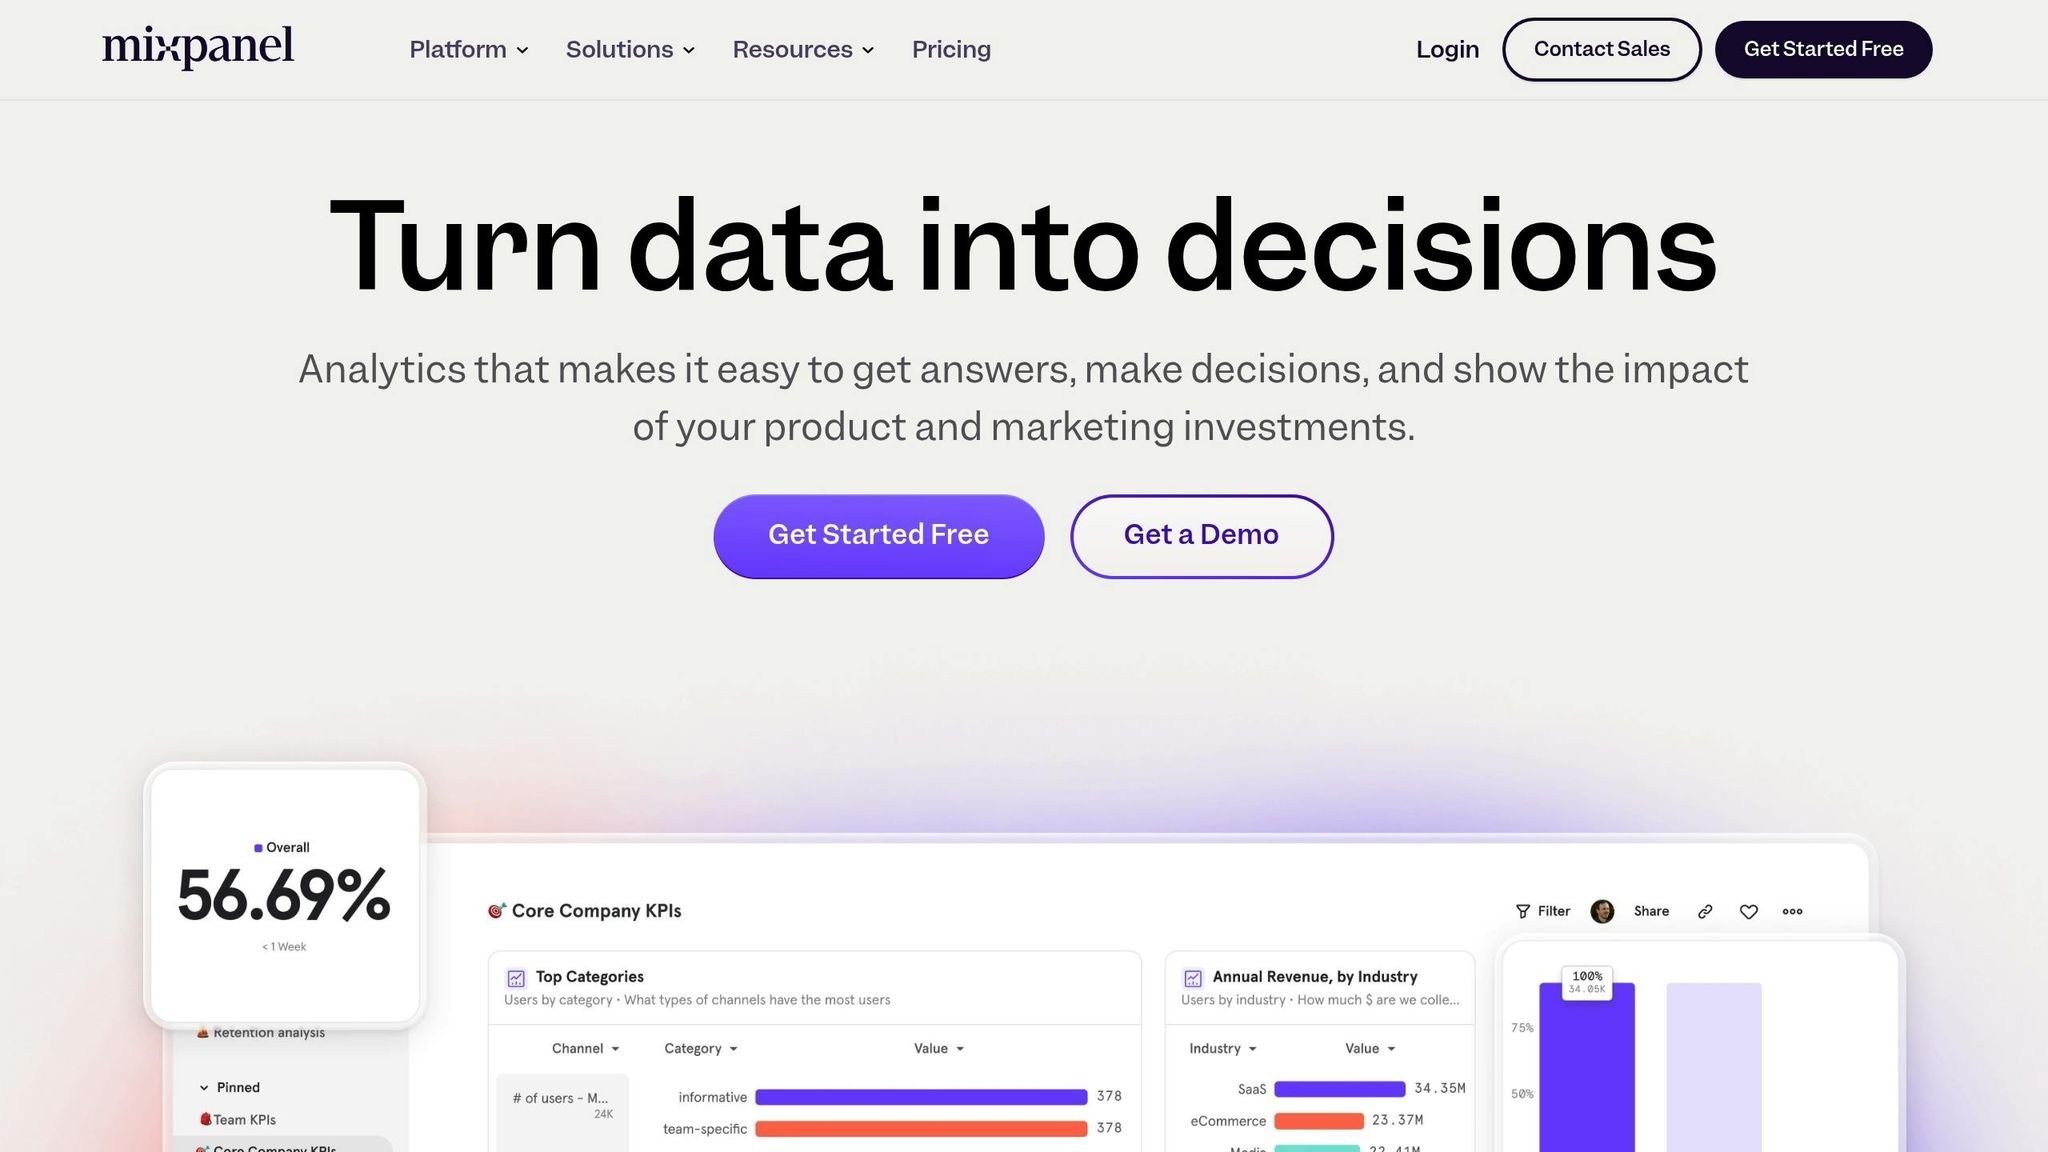
Mixpanel handles an impressive 5 trillion data points every year, supporting over 20,000 companies in 150 countries to make smarter, data-backed decisions. Its tools are designed to deliver insights that drive action, which we'll break down here.
Building on earlier analytics platforms, Mixpanel sharpens the focus with improved segmentation and visualization tools, helping businesses fine-tune user engagement.
Real-Time Analytics Features
| Feature | Purpose | Key Benefit |
|---|---|---|
| Event Tracking | Monitor specific user actions | Quick insights into engagement trends |
| User Journey Mapping | Follow user progression through content | Spot drop-offs and improve flow |
| Segmentation Analysis | Group users by behavior | Develop more targeted strategies |
| Custom Properties | Set unique tracking parameters | Gain tailored insights for your goals |
Success Stories and Impact
Companies using Mixpanel have seen measurable improvements in performance. For example:
- DocuSign increased account creation by 15% and improved signer-to-sender conversions by 19%.
- Wilco slashed onboarding time from over 24 hours to just 9 minutes using Mixpanel's Flows and Funnels.
"What started as a need for simple marketing metrics turned into custom product metrics for more than 100 different stakeholders across the company."
– Drew Ashlock, Senior Product Manager @ DocuSign
Advanced Tracking Capabilities
Mixpanel's Account Analytics is a game-changer for B2B companies, allowing them to track engagement at the account level, not just individual users. Its data model is built around three core elements:
- Events: Logs user interactions.
- Users: Monitors behavior and engagement.
- Properties: Lets businesses define custom tracking parameters.
With real-time visualizations like line charts, bar charts, and funnels, businesses can quickly identify and resolve engagement challenges.
Integration and Implementation
Mixpanel works seamlessly with tools like Segment and data warehouses such as Snowflake, BigQuery, and Amazon Redshift. To get the most out of it, plan your event tracking strategy carefully. Focus on the metrics that matter most and use custom properties to create detailed user segments. This integration ensures a connected approach to tracking and analyzing content performance in real time.
5. HubSpot Email Analytics
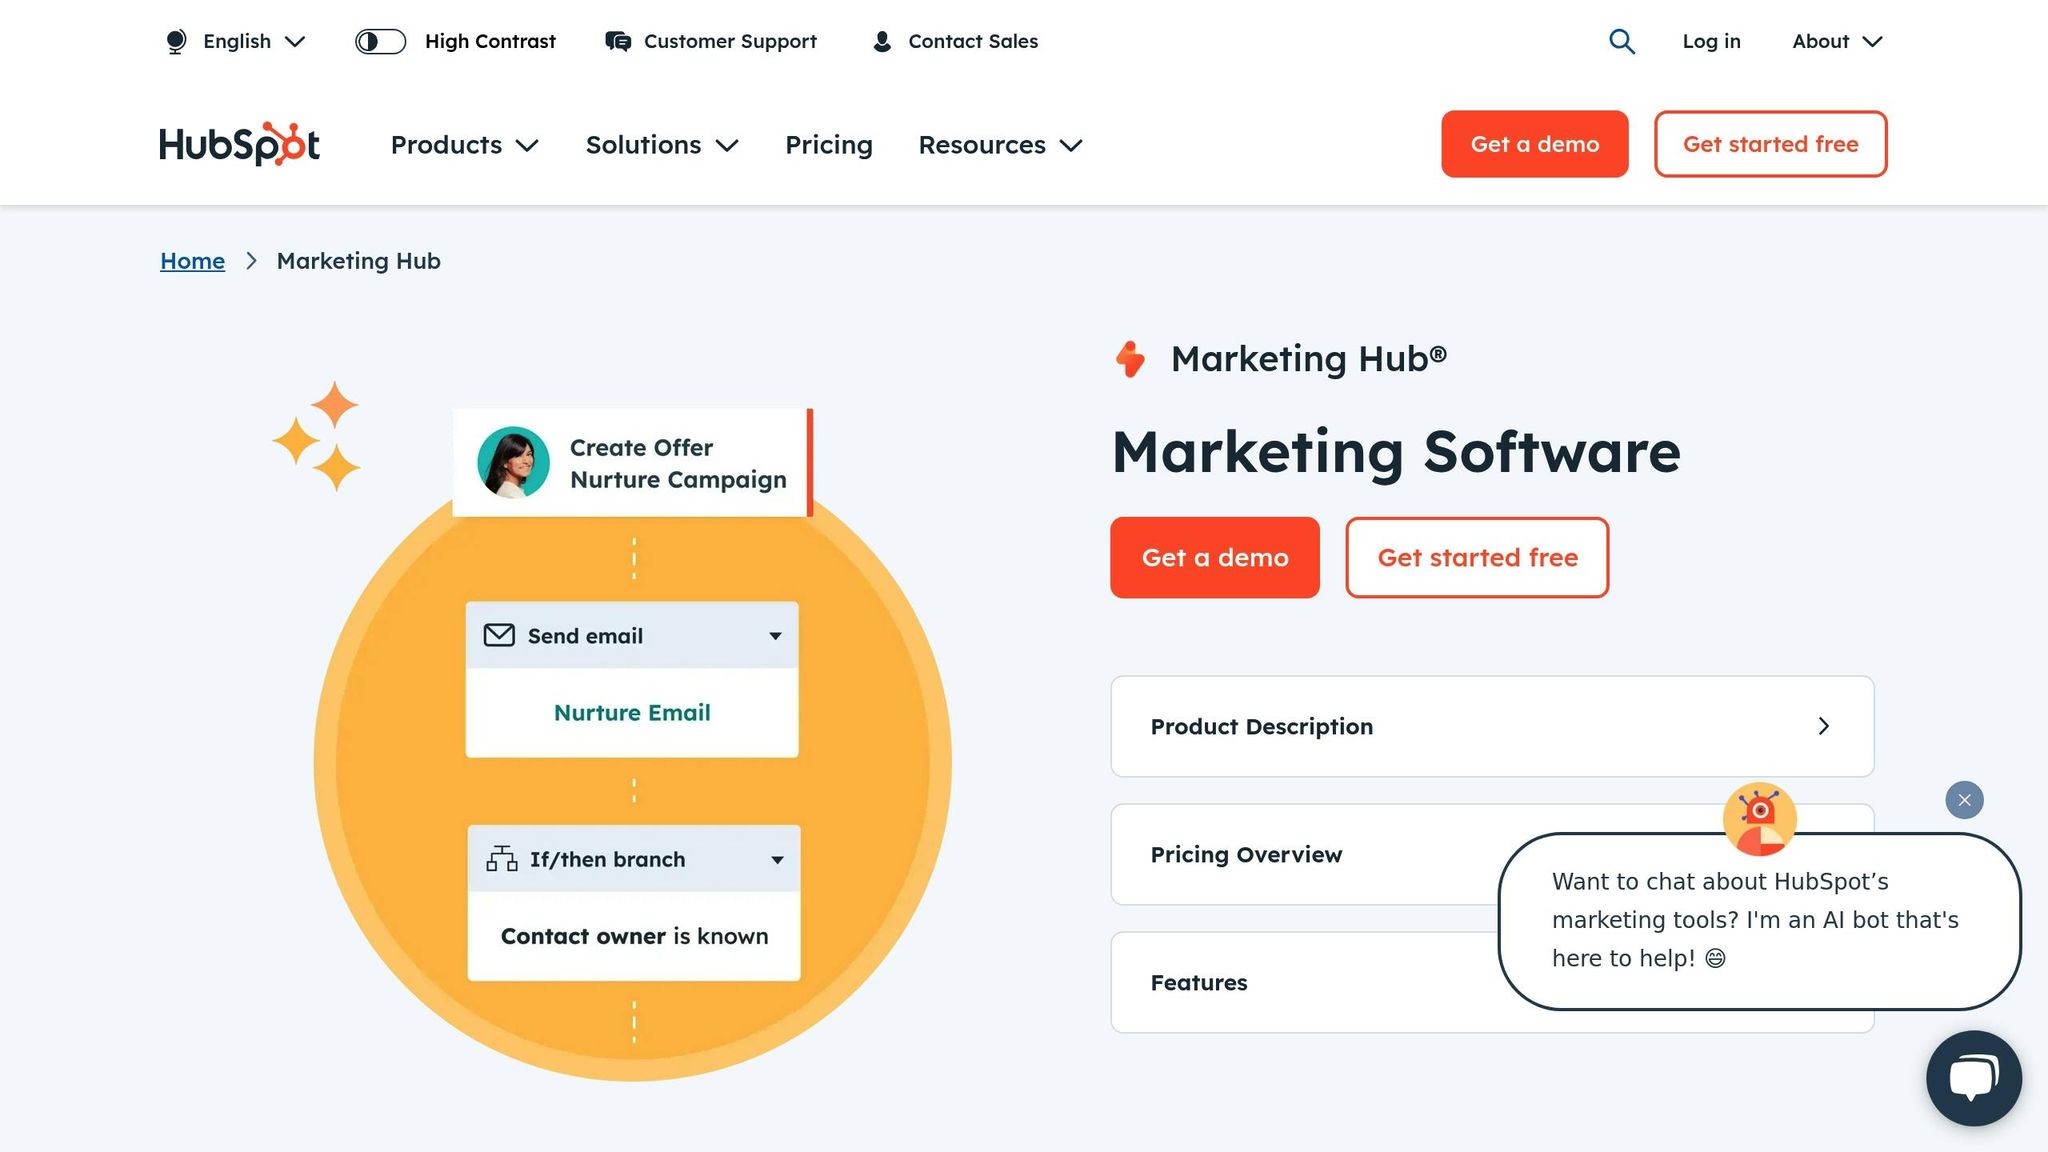
HubSpot offers real-time tracking to keep tabs on how recipients interact with your emails. By using its Performance and Recipients tabs, you can gain detailed insights that connect email marketing efforts to broader customer engagement strategies.
Key Tracking Features
| Feature | Metrics Tracked | Real-Time Advantages |
|---|---|---|
| Performance Dashboard | Opens, clicks, CTR | Immediate visibility into campaign results |
| Recipient Monitoring | Individual engagement, time spent | Contact-specific insights |
| Email Client Analysis | Device usage, client preferences | Helps fine-tune platform performance |
| Engagement Timeline | Time-based interaction patterns | Identifies peak engagement periods |
Advanced Engagement Metrics
HubSpot uses a one-pixel image technology to track email opens and link clicks, offering more precise data. This is especially useful in light of Apple's iOS 15 privacy updates, which have made traditional open rate metrics less reliable.
Real-time analytics also uncover trends like email list decay - on average, lists shrink by 22.71% annually. This underscores the importance of ongoing monitoring and shifting focus to actionable metrics like clicks and conversions, rather than just open rates.
"CTR is a crucial metric for all email marketers to track, as it gives direct insight into how many people on an email list are engaging with the content and interested in learning more about a brand or offer." - Erica Santiago, HubSpot Staff Writer
Tools for Boosting Engagement
HubSpot's tracking tools go beyond basic metrics to help optimize your email campaigns:
- Engagement Timeline Analysis: Pinpoints the best times to send emails based on historical data.
- Client-Specific Performance: Examines engagement across various email platforms to refine targeting.
- Conversion Tracking: Measures how email interactions lead to specific actions, like purchases or sign-ups.
Seamless Integration with CRMs
HubSpot's email analytics work effortlessly with popular CRM systems such as Salesforce, Microsoft Dynamics 365, and Zoho CRM. This integration gives you a full picture of customer engagement, from the first email open to the final conversion.
Prioritizing Data Privacy
HubSpot filters out suspected bot activity from its analytics. It also ensures that tracking is only applied to contacts who have provided legal consent, keeping metrics accurate and compliant.
Since 33% of marketers rank clickthrough rate as one of their top two metrics, HubSpot's tools make it easier to adjust campaigns quickly, driving better engagement and results.
6. Sprout Social Live Metrics
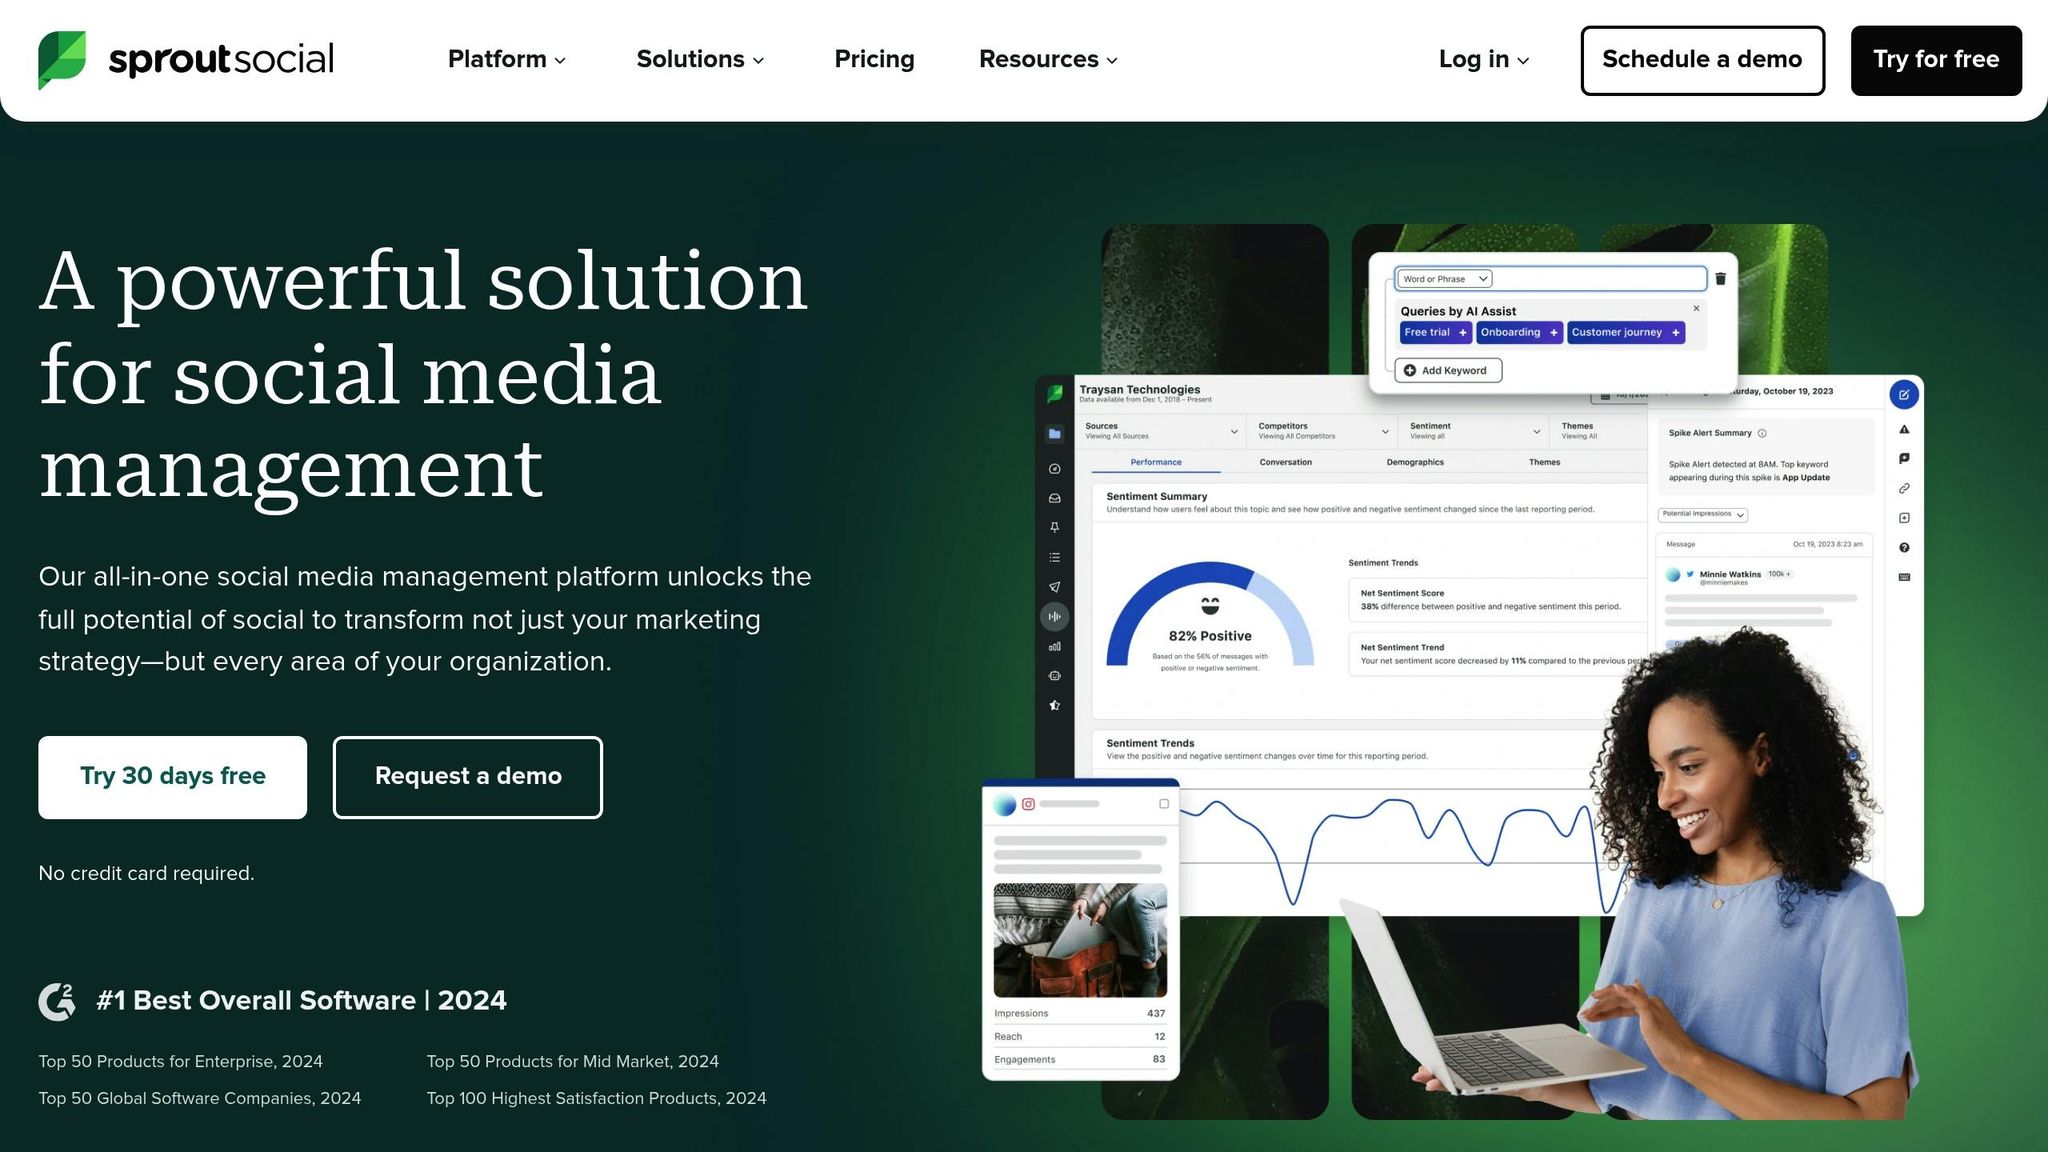
Sprout Social helps businesses monitor social media engagement and make quick, informed decisions. Handling 3.7 million social messages annually, it delivers insights that drive action.
Real-Time Performance Monitoring
| Metric Category | Key Indicators | Business Impact |
|---|---|---|
| Engagement | Impressions, clicks, responses | Tracks how well content connects with audiences |
| Audience Growth | New followers, reach potential | Monitors community growth |
| Response Time | First reply time, resolution rate | Assesses customer service efficiency |
| Sentiment | Positive/negative/neutral ratios | Measures brand perception |
Advanced Analytics Features
Sprout Social separates paid and organic metrics, offering detailed insights across platforms. For example, Trek Bikes used this feature to increase their total social engagements by an impressive 1,002%. These detailed metrics ensure quick and accurate reporting.
Tag Report System
Sprout Social simplifies reporting with tools like the Tag Report. Bret Neuman, Head of Social & Video Media at Rover, shared:
"If somebody drops by with a last‑minute request to pull some numbers, I run a Tag Report to quickly provide impressions, clicks, and engagement data."
Customer Service Metrics
Streamlining customer support is another strength of the platform. With its Smart Inbox feature, businesses can manage multiple communication channels in one place. Papa Johns, for instance, reduced the time spent on handling 600 weekly cases, saving 830 hours annually.
ROI Measurement
Sprout Social helps businesses demonstrate the value of their social media efforts. Sean Anderson, Communications Specialist, noted:
"Our team provides the C‑suite with the typical monthly metrics - impressions, engagement, new followers, etc. But it's the Potential Reach we provide quarterly that really shows them the extent of our social media messaging and proves the power and value of social media versus traditional press and advertising."
Performance Optimization Tools
Sprout Social offers a range of tools to enhance performance:
- Hashtag tracking to extend reach
- Post Performance Reports for cross-channel insights
- Competitor Reports to benchmark against industry peers
- Team Activity Reports to measure productivity
- Google Analytics integration to monitor website traffic
These tools allow businesses to stay ahead of engagement trends. This is especially critical, as 73% of social users are likely to switch to a competitor if brands fail to respond to them on social media.
7. Optimizely Testing Results
Optimizely takes content performance tracking to the next level with its powerful A/B testing tools and detailed analytics. Its platform provides real-time insights, helping businesses make data-backed decisions. The Stats Engine, a standout feature, combines sequential testing with false discovery rate control for accurate and reliable results.
Real-Time Metrics Dashboard
| Metric Type | What It Tracks | Business Value |
|---|---|---|
| Primary Metrics | Clicks, pageviews, form submissions | Highlights top-performing content |
| Secondary Metrics | Scroll depth, time on page | Offers deeper insights into engagement |
| Conversion Goals | Purchases, sign-ups | Tracks actions that impact revenue |
| User Behavior | Navigation patterns, interaction points | Identifies trends in user engagement |
Statistical Analysis Features
The Stats Engine ensures that testing results are both accurate and fast. By applying sequential testing alongside false discovery rate control, Optimizely makes sure that decisions are based on reliable data.
Integration Capabilities
Optimizely works seamlessly with other analytics tools, ensuring data is updated quickly. This smooth integration helps teams make informed decisions without delays.
Proven Results
In one example, a homepage A/B test that added an interactive image led to a threefold increase in content consumption.
Expert Perspective
"It's about being humble... maybe we don't actually know what's best, let's look at data and use that to help guide us".
Performance Optimization
Spotify offers a great case study. In March 2023, they used Optimizely's Email Verification API to reduce their email bounce rate from 12.3% to 2.1%. This improvement boosted email deliverability by 34%, added $2.3M in revenue, and enhanced their database of 45 million subscribers.
Advanced Testing Features
Optimizely's tools go beyond basic testing, offering advanced features such as:
- Segmentation Analysis to break down results by user groups
- Automatic calculations for statistical significance
- Tracking user journeys across multiple pages
- Custom Event Tracking for monitoring specific interactions
These capabilities allow teams to fine-tune their strategies with precision and speed.
Conclusion
Real-time tracking equips B2B SaaS companies with the ability to make fast, informed decisions. The tools mentioned here offer solutions for monitoring user behavior, analyzing interactions, and tracking conversions.
Getting Started with Engagement Tracking
Choose tools that align with your business objectives. For example, Attention Insight boosted engagement by 47% using interactive walkthroughs, while The Room achieved a 75% increase in customer activation within just 10 days.
Tool Selection Strategy
| Business Goal | Recommended Tool | Key Advantage |
|---|---|---|
| User Interaction | ChatHQ | Free-tier options with engagement widgets |
| Revenue Intelligence | Gong | Focused on revenue insights |
| Customer Retention | WebEngage | Comprehensive engagement platform |
| Product-Led Growth | Flywheel | Combines analytics, reducing the need for multiple tools |
These tools are tailored to help you achieve measurable results based on your goals.
Proven Success Stories
Real-world examples back these strategies. Sked Social tripled conversion rates using an onboarding checklist, while Getcraft doubled user activation and improved profile completion rates from 20% to over 40%.
Expert Insights
"It's obvious that Flywheel took an account-first approach to analytics and insights. User-only analytics are on their way out for B2B."
- Manav Dalmiya, Data Analytics Lead
Implementation Best Practices
-
Define Core Metrics
Focus on engagement actions that directly impact your business goals, such as sales, subscriptions, or customer satisfaction. -
Tool Implementation
Start with tools that address your immediate needs. As Shreekant Chetlur notes:"WebEngage has been a game-changer, helping us automate tasks, personalize customer journeys, and reach the right audience, leading to higher revenue growth".
-
Continuous Optimization
Use engagement data to refine your approach. For instance, ClearCalcs improved activation rates by segmenting users based on their roles and objectives.
By aligning your metrics with the right tools, you can set the stage for ongoing improvement. Recent studies show that 42% of companies enhanced their content marketing efforts by updating existing content based on engagement insights.
Platforms like Journey.io demonstrate how combining content delivery with real-time analytics can simplify customer activation and fuel growth.